The Economic Update report gives current data, trends and benchmarking information. These are around:
- Employment
- Unemployment.
- Business.
- Skills.
- House prices.
The local picture
Calderdale's rank of IMD worsened from 105th most deprived out of 326 local authorities in 2010 to 89th most deprived in 2015.
The most deprived areas are Park, Ovenden and Illingworth/Mixenden wards.
There is a low population density with significant rurality. There are proportionally fewer adults aged 20 to 40 than aged 40 to 69. Nearly 90% of the population are of White ethnicity with 8% of Asian ethnicity. Approximately 18% of the population have a long-term condition which affects their daily activities. The following section provides some key data on Calderdale's economy.
2.1% of all worked hours are lost due to sickness in Yorkshire and the Humber'. In other areas, this ranged from 1.4% in London to 2.6% in Wales (ONS, 2016). The loss in productivity related to ill health can be estimated to be approximately £300 million pounds a year. (Based on a population of approximately 210,000 people, using £100Bn, figure from (Black and Frost, 2011)).
Calderdale has relatively high employment compared with other local authorities in West Yorkshire. Though, the difference with the regional average is not statistically significant. Figure: Employment rate in 16-64 year olds for West Yorkshire local authorities (NOMIS, Annual Population Survey, August 2017).
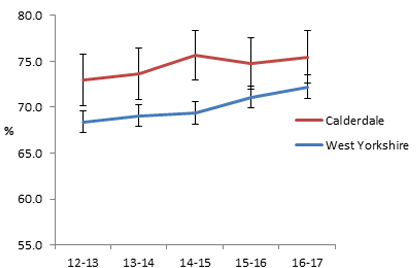
Figure: Employment rate in 16-64 year olds for West Yorkshire local authorities (NOMIS, Annual Population Survey, August 2017).
Unemployment in Calderdale has decreased and is significantly lower than for other local authorities in West Yorkshire.
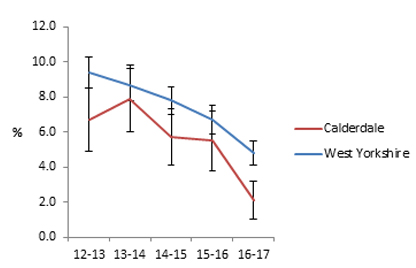
Figure: Percentage unemployment in 16-64 year olds for West Yorkshire local authorities (NOMIS, Annual Population Survey, August 2017).
There has been an overall decrease in the number of people employed by banks in this time. Although, there has been a substantial increase in the number of people employed through temporary employment agencies. This could potentially have implications for financial stability with mental health impacts.
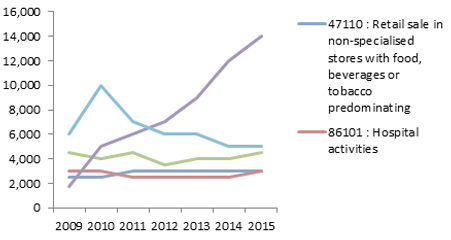
Figure: Number of jobs in the five largest employing sectors in Calderdale, 2009-2015 (August 2017).
Manufacturing and business admin are the largest sectors. This may have implications for example for injuries at work or for occupational health within offices. The sectoral breakdown also has implications depending on Calderdale's vision in terms of which sectors will need prioritising.
Figure: Number of jobs in 5 largest employing sectors in Calderdale, 2009-2015 (August 2017).
(Note: Due to recent concern regarding a potential drop in median weekly earnings the following section was updated in January 2017).
Taking potential statistical variation into account, there is no significant change in median weekly earnings in the last six years. Though, recent concerns have emerged over a drop within year and this will need to be monitored. 2017 provisional results show Calderdale has the third highest median weekly pay rate in West Yorkshire.
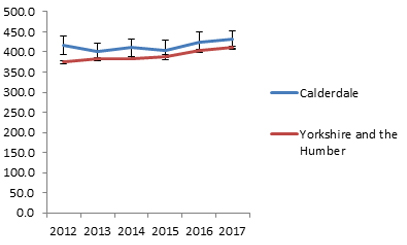
Figure: Median weekly pay for all workers (NOMIS Annual Survey of Hours and Earnings, August 2017).
Calderdale is doing well relative to other places in West Yorkshire in terms of NVQ4. It is not possible to deduce any clear time trends as changes could be due to statistical variation.

Figure: % of people aged 16-64 with an NVQ4 (NOMIS, Annual Population Survey, August 2017).
Relative to other local authorities in the region Calderdale is offering significant access to apprenticeships.
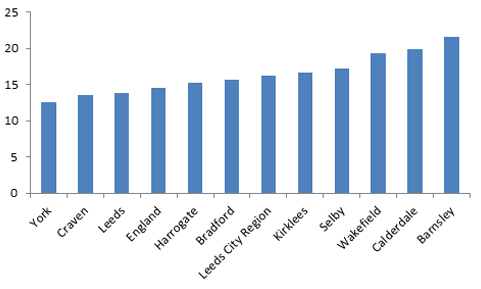
Figure: Apprenticeships per 1000 population for England, Leeds City Region and Local Authorities (August 2017).
The impact of the floods on the health of the population constitutes a dual burden. Both through the direct impacts on health and through the indirect effects on business.
Employment and Support Allowance is paid to working age people with diagnosed health issues that prevent them from working. Claimant rates in Calderdale have been relatively high in recent years. In May 2017 it was 7.1% in Calderdale compared with 6.6% in Leeds City Region 5.7% in England. In time this benefit will be replaced by Universal Credit.
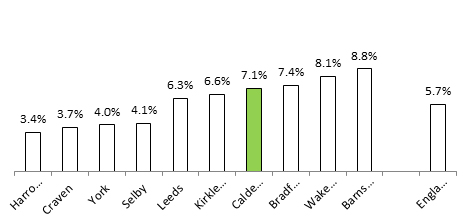
Figure: Employment Support Allowance Claimant Rates: May 2017 (DWP, Nomisweb).
Inequalities
Economic inequalities are a key driver of health inequalities. These, in turn, represent a major loss in economic terms.
- People in deprived areas tend to have fewer opportunities for education and for secure and fulfilling work.
- Inclusivity is increasingly recognised as a key value that should underpin any work around the economy.
Current provision
The council provides business support and capital projects, as well as analysis and governance. Business plays a large part in the local economy. There is:
- A healthy workforce network;
- an employment and skills group;
- a developing network of anchor organisations;
- a stream of work with the local VCS;
- and work with specific sectors.
User views
A business skills survey will be undertaken in June in collaboration with Calderdale College.
Unmet needs
The concept is hard to apply the concept of need directly, in broad terms like:
- Health and the economy;
- and the economic determinants of health.
Broad population demographics and deprivation are addressed elsewhere in the JSNA. Ongoing austerity both reduces capacity to deliver large scale change and may have wider health impacts.
Projected future needs
Moving forward, it is important to have a coherent and shared vision of the economy in Calderdale. Also, interconnected action on key areas of work. Leadership, governance and accountability around key metrics tied to the vision are needed to ensure that the vision is achieved.
Key considerations linked to the known evidence base (what works?)
Recommendations
These recommendations have been developed based on the analysis above and through conversations with local stakeholders.
For Local Authority
- Ensure there is a visible, high ownership and multi-stakeholder economic strategy.
- Embed social value within all public sector procurement, capital expenditure and commissioning. This is done through clear targets for consideration of social value and action learning.
- Market shaping to nurture local supply chains.
- An increasing focus on social enterprise and cooperatives (Perotin, n.d) (Roy et al, 2012).
- Focus on the role as anchor institution (Devins et al, 2017).
- Work to increase the number of organisations signed up to and delivering a living wage.
- Make use of existing groups such as healthy workforce group and employment and skills panel to develop broader engagement.
- Consider the use of integrated impact assessments for capital development projects.
- Sector specific analyses for economic sectors.
- Rigorous inclusion of agreed data and metrics in local economic strategy. Make sure that these are regularly reported on (for example, include in as part of economic update / JSNA). Focus on people rather than productivity or growth (RSA, 2017 or Dietz and O'Neill, 2013).
- Consider governance and resource implications carefully.
For the health sector
- Consider carefully employment issues along health issues.
- Develop role as anchor institution using estates, HR and such.
- Embed social value within procurement.
- Consider carefully where healthcare sector can add value to the economy, for example start-ups/digital/and such.
References and further information
- Black, C. And Frost, D. (2011) Health at work – an independent review of sickness absence.
- Devins, D. Et al (2017) Maximising the local impact of anchor institutions: a case study of Leeds City Region. JRF.
- Dietz and O'Neill (2013). Enough is Enough – building a sustainable economy in a world of finite resources.
- ONS (2016) Sickness absence in the labour market.
- Perotin, V., What Do We Really Know About Worker Co-operatives.
- Roy, M. Et al (2012) The potential of social enterprise to enhance health and well-being: A model and systematic review. Social Science & Medicine.
- RSA (2017) Inclusive Growth Commission Report.
- Wilkinson, R. And Pickett, K. (2010) The Spirit Level: Why Equality is Better for Everyone.
Authors
Public Health Specialty Registrar, CMBC (February, 2017).